CHAPTER I
OVERVIEW
The
monthly accounts of the State Government are compiled and consolidated from the
accounts submitted by the District Treasuries, Public Works and Forest
Divisions, etc. to the Accountant General (Accounts and Entitlements). Besides,
the Finance Accounts and the Appropriation Accounts are prepared annually by
the Accountant General under the directions of the Comptroller and Auditor
General of India in accordance with the requirements of the Comptroller and
Auditor General’s (Duties, Powers and Conditions of Service) Act, 1971.
The
accounts of Government are kept in the following three parts:
Part I Consolidated Fund
Part II Contingency Fund
Part III Public Account
There
are two main divisions under the Consolidated Fund:
The Revenue
division (Revenue Account) deals with
the proceeds of taxation and other receipts classed as revenue and the
expenditure met therefrom, the net result of which represents the revenue
surplus or deficit for the year.
In the
Capital division, the section ‘Receipt Heads (Capital Account)’ deals with
receipts of capital nature, which cannot be applied as a set off to capital
expenditure. The section ‘Expenditure Heads (Capital Account)’ deals with
expenditure met usually from borrowed funds with the object of increasing
concrete assets of a material and permanent character. It also includes
receipts of a capital nature intended to be applied as a set off to capital
expenditure. The section ‘Public Debt, Loans and Advances, etc.’ comprises
loans raised and their repayments by government such as ‘Internal Debt’ and
‘Loans and Advances’ made (and their recoveries) by government.
In the
Contingency Fund, the transactions connected with Contingency Fund established
under Article 267 of the Constitution
of India are recorded.
In the
Public Account, the transactions relating to ‘Debt’ (other than those included
in Part I), ‘Deposits’, ‘Advances’, Remittances and ‘ Suspense’ are recorded.
Annual
Accounts of the Government of Andhra Pradesh for the year 2007-2008 have
recently been presented to the State Legislature. Audit Report of the
Comptroller and Auditor General of India for the year 2007-2008 is being
presented separately.
Finance
Accounts
Finance Accounts present the accounts of receipts and disbursements
of the government for the year together with the financial results disclosed by
the revenue and capital accounts, the accounts of the public debt and the
liabilities and assets as worked out from the balances recorded in the
accounts.
During
the year 2007-2008 total receipts amounted to Rs.69,678.23 crore
comprising Rs.54,142.55 crore
revenue receipts (Rs.39,977.69 crore tax revenue, Rs.7,064.13 crore non-tax
revenue and Rs.7,100.73 crore grants-in-aid from Government of India) and Rs.15,535.68
crore capital receipts (Rs.190.95 crore towards recovery of loans and advances,
Rs.8,787.02 crore on account of borrowings and other liabilities and
Rs.6,557.71 crore in respect of MH 4000 – Misc. Capital Receipts).
Disbursements
during the year were Rs.69,678.23 crore – Rs.53,983.57 crore (77.48%) on
revenue account and Rs.15,694.66 crore (22.52%) on capital account, including
disbursements of Rs.2,920.72
crore towards Loans and Advances.
In
deviation from the prescribed accounting practice, an amount of Rs.6,557.71
crore relating to regularisation of land and property has been classified under
Major Head 4000 – Miscellaneous Capital Receipts instead of under Revenue
Receipts. This has resulted in under statement of Revenue Surplus to that
extent. The receipts thus classified, wherever noticed, has been suitably
indicated by footnotes in the relevant statements of Finance Accounts for
2007-08.
Appropriation
Accounts
Appropriation
Accounts bring out the expenditure of the State Government against amounts
voted and charged by the State Legislature and supplement the Finance
Accounts. These comprise accounts
of 24 charged Appropriations and 40
voted Grants.
Appropriation
Act, 2007-2008 had provided for a gross expenditure of Rs.88,450.66 crore. An amount of Rs.165.73 crore was projected
as recoveries in reduction of expenditure.
Appropriation
Accounts 2007-2008 disclosed that total gross expenditure was Rs.75,341.04
crore as against the budget provision of Rs. 88,450.66 crore. There was a net saving of Rs.13,310.93
crore.
Recoveries
in reduction of expenditure amounted to Rs.669.33 crore reflecting an increase
of Rs.503.60 crore vis-a-vis budget
estimates.
CHAPTER II
HIGHLIGHTS OF ACCOUNTS
(Rupees
in crore)
|
Sl.
No |
|
B.E 2007-
2008 |
Actuals |
Percentage of Actuals
to B.E |
Percentage of Actuals to GSDP(311752($)) |
|
1. |
Tax Revenue(@)
|
40589.88 |
39977.69 |
98.49 |
12.82 |
|
2. |
Non-Tax
Revenue |
6857.62 |
7064.13 |
103.01 |
2.27 |
|
3. |
Grants-in-aid
& Contributions |
7502.08 |
7100.73 |
94.65 |
2.28 |
|
4. |
Revenue
Receipts (1+2+3) |
54949.58 |
54142.55 |
98.53 |
17.37 |
|
5. |
Recovery of
Loans & Advances |
275.80 |
190.95 |
69.23 |
0.06 |
|
6. |
Other Receipts |
9400.00 |
6557.71 |
69.76 |
2.10 |
|
7. |
Borrowings and
other liabilities |
8620.63 |
8787.02 |
101.93 |
2.82 |
|
8. |
Capital
Receipts (5+6+7) |
18296.43 |
15535.68 |
84.91 |
4.98 |
|
9. |
Total Receipts
(4+8) |
73246.01 |
69678.23 |
95.13 |
22.35 |
|
10 |
Non-Plan
Expenditure (NPE) |
40272.85 |
40690.79 |
101.03 |
13.05 |
|
11. |
NPE on Revenue
Account |
39318.14 |
40082.98 |
101.95 |
12.86 |
|
12. |
NPE on
Interest Payments out of 11 |
8628.63 |
7588.72 |
87.95 |
2.43 |
|
13. |
NPE on Capital
Account |
954.71 |
607.81 |
63.66 |
0.19 |
|
14. |
Plan
Expenditure (PE) |
32973.16 |
28987.44 |
87.91 |
9.30 |
|
15. |
PE on Revenue
Account |
15667.92 |
13900.59 |
88.72 |
4.46 |
|
16. |
PE on Capital
Account |
17305.24 |
15086.85 |
87.18 |
4.84 |
|
17. |
Total
Expenditure (10+14) |
73246.01 |
69678.23 |
95.13 |
22.35 |
|
18. |
Revenue
Expenditure (11+15) |
54986.06 |
53983.57 |
98.18 |
17.32 |
|
19. |
Capital
Expenditure (13+16)(#) |
18259.95 |
15694.66 |
85.95 |
5.03 |
|
20. |
Revenue
Surplus (4-18)* |
(-)36.48 |
158.98 |
(-) 435.80 |
0.05 |
|
21. |
Fiscal Deficit
(4+5+6-17) |
8620.63 |
8787.02 |
101.93 |
2.82 |
(@) Includes state’s share of Union
Taxes of Rs.11183.64 crore
(*) The Revenue Surplus is understated by Rs.6,557.71
crore due to incorrect classification of sale proceeds of land and property
under
MH4000
– Misc. Capital Receipts.
($) GSDP figure adopted is as per Economic Survey
published by Planning Department of Government of Andhra Pradesh.
(#) Expenditure on Capital Account includes Capital
Expenditure (Rs12,773.94 crore) and Loans and Advances disbursed (Rs.2,920.72
crore).
Receipts and Disbursements
Total receipts during the year (excluding Borrowings and
Other Liabilities Rs.8,787.02 crore) were Rs.60,891.21 crore, against which
total disbursements were Rs.69,678.23 crore.
The resulting deficit of Rs.8,787.02 crore is more by Rs.166.39 crore in
comparison to Budget Estimates (Rs.8,620.63 crore).
The following table summarises the accounts for 2007-2008
(Rupees in crore)
|
Total
Receipts |
69678.23 |
Total
Disbursements |
69678.23 |
|
Revenue Receipts |
54142.55 (77.70%) |
Revenue Disbursements |
53983.57 (77.48%) |
|
Capital Receipts |
15535.68 (22.30%) |
Capital Disbursements |
15694.66 (22.52%) |
RECEIPTS
Revenue
Receipts
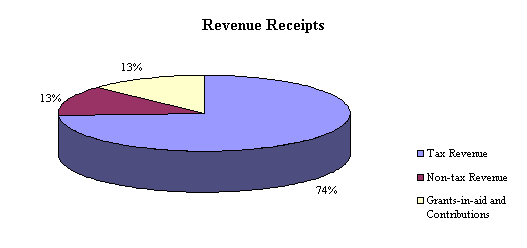
Gross
Tax Revenue of Rs.39,977.69 crore and Non-Tax Revenue of Rs.7,064.13 crore
formed 12.82 per cent and 2.27 per
cent respectively of the GSDP. Major
contributors to revenue were Taxes on Taxes on Commodities and Services
(Rs.30,365.87 crore – 9.74% of GSDP), Income and Expenditure (Rs.6,287.18
crore- 2.02% of GSDP) and Taxes on Property and Capital Transactions
(Rs.3,324.64 crore – 1.07% of GSDP).
Non-Tax revenue during the year
were more than the budget estimates by Rs.206.51 crore, mainly on account of
good collection under various receipt heads. The increase was partly due to
higher collection from Interest Receipts (Rs.3,525.34 crore – 1.13% of GSDP)
and other Rural Development programmes (Rs.296.61 Crore – 0.10% of
GSDP).Receipts of Rs.778.64 crore uder Miscellaneous General Services include
debt relief of Rs.703.08 crores given by Ministry of Finance, Department of
Expenditure on repayment of consolidated loan.
Share
of various tax, non-tax revenue and grants-in-aid and contributions to total
revenue receipts is given below:
Revenue Receipts and Grants-in-Aid and Contributions
(Rupees in crore)
|
Components |
Actuals |
Percentage to
total Revenue Receipts |
A.
Tax Revenue
|
39977.69 |
73.84 |
|
Taxes on Income and Expenditure |
6287.18 |
11.61 |
|
Taxes on Property and Capital
Transactions |
3324.64 |
6.14 |
|
Taxes on Commodities and
Services |
30365.87 |
56.09 |
|
B. Non-tax Revenue |
7064.13 |
13.05 |
|
Interest Receipts, Dividends and
Profits |
3537.29 |
6.53 |
|
General Services |
987.77 |
1.83 |
|
Social Services |
194.01 |
0.36 |
|
Economic Services |
2345.06 |
4.33 |
|
C. Grants-in-aid and Contributions |
7100.73 |
13.11 |
|
TOTAL-REVENUE RECEIPTS |
54142.55 |
100.00 |
Capital
Receipts
Compared
to the Budget estimates of Rs.18,296.43 crore, the actual receipts were
Rs.15,535,68 crore resulting in an overall shortfall of Rs.2,760.75 crore.
Borrowings was more by Rs.166.39 crore against Budget Estimates, inter-alia
other receipts and recovery of loans
and advances.
DISBURSEMENTS
Revenue
Disbursements
Revenue
Disbursement was 17.32 per cent of GSDP.
It was less than budget estimates by
Rs.1,002.49 crore of which Rs.764.84 crore was more under Non-plan
Expenditure and Rs.1,767.33
crore less under Plan Expenditure.
Capital
Disbursements
Capital Disbursements were
5.03 per cent of the GSDP. It was less than budget estimates by Rs.2,565.29 crore due to less disbursement
of Rs.2,218.39 crore under Plan Expenditure and Rs.346.90 crore less under Non-plan Expenditure.
Plan
Disbursements
During
the year 2007-2008, Plan Disbursements were Rs.28,987.44 crore consisting
of Rs.25,017.91 crore under State
Plan, Rs.1,748.35 crore under Centrally Sponsored Plan and Rs.2,221.18 crore under Loans advanced by
the State Government out of which Rs.2,160.25 crore was disbursed under State
Plan and Rs.60.93 crore pertains to Centrally Sponsored Plan.
Non-Plan
Disbursements
Non-plan
Disbursements during 2007-2008 were Rs.40,690.79 crore, consisting of
Rs.40,082.98 crore under Revenue Expenditure and Rs.607.81 crore under Capital
Expenditure.
Sectoral distribution of expenditure and its percentage to total revenue expenditure (Rs.53,983.57 crore) is given in the following table.
(Rupees in crore)
|
Components |
Amount |
As % of Total Revenue Expenditure |
|
A. Fiscal Services |
621.97 |
1.15 |
|
(i)
Collection of Taxes on Property and Capital transactions |
151.99 |
0.28 |
|
(ii) Collection of Taxes on Commodities and Services |
406.89 |
0.75 |
|
(iii) Other Fiscal Services |
63.09 |
0.12 |
|
B. Organs of State |
366.57 |
0.68 |
|
C. Interest Payments and Servicing of debt |
7965.83 |
14.76 |
|
D. Administrative Services |
4123.23 |
7.64 |
|
E. Pensions and Miscellaneous General
Services |
5092.64 |
9.43 |
|
F. Social Services |
18660.38 |
34.57 |
|
G. Economic Services |
16904.11 |
31.31 |
|
H. Grants-in-aid and Contributions |
248.84 |
0.46 |
|
Total Expenditure (Revenue Account) |
53983.57 |
100.00 |

TREND OF EXPENDITURE
Trend
of expenditure in some important sectors between 2003-2004 and 2007-2008 (5 years)
is brought out in the following table.
Statement of Revenue Expenditure in Selected Sectors
(Rupees
in crore)
Sector
|
2003-2004 % to B.E/R.E |
2004-2005 % to B.E./R.E |
2005-2006 % to B.E./R.E. |
2006-2007 % to B.E./R.E. |
2007-2008 % to B.E./R.E. |
|
A. Social
Services |
|
|
|
|
|
i) Education
|
4665.77 91.96/100.35 |
4592.76 83.42/85.30 |
5337.53 91.10/84.10 |
6035.62 85.31/85.62 |
6604.83 81.95/76.77 |
ii) Health &
Family
Welfare
|
1476.08 90.11/89.89 |
1487.07 90.68/88.74 |
1616.47 91.03/94.11 |
1853.93 90.48/91.57 |
2439.05 97.70/100.40 |
B.
Economic
Services
|
|
|
|
|
|
i) Agriculture
|
1083.69 95.90/98.05 |
1196.11 79.62/80.62 |
1199.82 82.07/82.83 |
1438.12 86.43/86.93 |
2074.68 103.31/101.88 |
ii) Rural
Development
|
1595.72 82.41/97.95 |
1620.85 92.78/91.78 |
1691.26 104.78/97.77 |
2445.95 89.66/92.67 |
3000.54 119.24/117.61 |
iii) Irrigation &
Flood Control
|
1875.34 91.97/93.96 |
1921.37 89.81/84.48 |
2620.41 92.16/81.77 |
3176.55 73.40/70.30 |
4658.63 83.95/84.94 |
iv) Energy
|
1644.42 94.68/95.15 |
1896.08 91.92/95.96 |
1801.40 100.07/102.81 |
1601.12 101.55/117.67 |
4598.74 178.17/178.36 |
v) Transport
|
561.21 87.67/106.61 |
570.18 88.30/98.36 |
1040.78 159.31/139.00 |
1134.25 123.85/105.47 |
1527.27 109.18/109.64 |
vi) General
Economic
Services
|
382.64 89.03/111.25 |
269.36 55.59/50.47 |
429.49 78.10/76.27 |
474.93 82.76/82.74 |
511.46 68.31/70.17 |
DEBTS
AND LIABILITIES
Outstanding
Public Debt at the end of 2007-2008 was Rs.51,394.89 crore, comprising internal
debt of Rs.36,269.20 crore and loans and advances from Central Government of
Rs.15,125.69 crore and other liabilities accounted under Public Account are
Rs.45,973.60 crore.
The
State also acts as a banker and trustee in respect of deposits like small
savings, provident funds and deposits. There was an overall increase of
Rs.4,607.36 crore in respect of such liabilities of State Government during
2007-2008.
Interest
payments on debt and other liabilities totaling Rs.7,588.72 crore constituted
14.06 percentage of revenue expenditure of Rs.53,983.57 crore. Interest payments on public debts were Rs.6,965.79 crore (Internal debt
Rs.5,940.36 crore, loans and advances from Central Governments Rs.1,025.43
crore) and Rs.622.93 crore on other liabilities. Expenditure on account of interest payments increased by
Rs.308.43 crore during 2007-2008 as compared to previous year.
Entire
amount of Internal debt of Rs.10,223.45 crore raised during 2007-2008 was
mainly utilized towards (i) Interest
payment of Rs.6,182.38 crore and (ii)
discharge of debt
obligations of
Rs.
4,041.07 crore.
INVESTMENTS
AND RETURNS
Total
investments as share capital in non-financial public sector undertakings (PSUs)
stood at Rs.5,931.42 croreat the end of 2007-2008. Dividends received during the year were Rs.11.95 crore (i.e.,
0.20%) on investment. During 2007-2008,
while investments increased by Rs.155.24 crore, over the previous year, the
dividend income decreased by Rs.35.45 crore.
LOANS
AND ADVANCES BY THE STATE GOVERNMENT
Total
loans and advances made by the State Government at the end of 2007-2008 is
Rs.13,377.92 crore. Recovery of
principal amount aggregating Rs.17,388.49(*)crore and interest on loan
amounting to Rs.4,959.31 crore is in arrears at the end of 31 March 2008.
Loans
and advances to Government Corporations/Companies, non-Government Institutes,
Local bodies, etc. at the end of 2007-2008 is Rs.13,160.95 crore.
FINANCIAL
ASSISTANCE TO LOCAL BODIES AND OTHERS
Assistance to local bodies etc during 2007-2008 was Rs.15,905.82 crore. It increased from Rs.9,527.06 crore in 2003-2004 to Rs.15,905.82 crore in 2007-2008, i.e., a 66.95 per cent increase in the last five years. The grants given to Zilla Parishads, Panchayat Samitis and Municipalities (Rs.3,620.08 crore) were about 22.76 per cent of total grants given during the year.
APPROPRIATION
ACCOUNTS
The
Appropriation Accounts of the Government of Andhra Pradesh for the year
2007-2008 present the accounts of sums expended in the year ended 31 March
2008, compared with the sums specified in the Schedules appended to the Appropriation
Acts passed under Article 204 and 205 of the Constitution of India.
The Appropriation Accounts show that in the year 2007-2008, there was actual expenditure of Rs.75,341.03 crore, comprising Rs.54,487.98 crore Revenue Expenditure, Rs.12,938.84 crore Capital Expenditure, Rs.4,993.49 crore Repayment of Debt, and Rs.2,920.72 crore Loans and Advances by the State Government.
(*)
The amount represents to the extent of information available
Summary of Appropriation Accounts 2007-2008
(Rupees in crore)
|
Sl. No. |
Nature of expenditure |
Original grant |
Supplementary
grant |
Re-appropriation |
Total |
Actual
expenditure |
Savings(-) Excesses(+) |
|
1 |
Revenue
Voted
Charged |
46430.17 8718.84 |
6342.57 7.28 |
(-)3303.60 (-)873.98 |
49469.14 7852.14 |
46813.76 7674.22 |
(-)2655.38 (-)177.92 |
|
2 |
Capital
Voted
Charged |
12761.19 110.66 |
817.30 2.70 |
(-)698.08 (-)1.84 |
12880.41 111.52 |
12895.75 43.09 |
(+)15.34 (-)68.43 |
|
3 |
Public
Debt
Charged |
7750.58 |
… |
(-)2757.09 |
4993.49 |
4993.49 |
-- |
|
4 |
Loans and
Advances
Voted |
5390.89 |
118.48 |
(-)2560.56 |
2948.81 |
2920.72 |
(-)28.09 |
|
|
Total |
81162.33 |
7288.33 |
(-)10195.15 |
78255.51 |
75341.03 |
(-)2914.48 |
Details
of persistent savings in a few selected grants/appropriations are given below:
TREND OF EXPENDITURE ON SELECTED GRANTS SHOWING PERSISTENT
SAVINGS
Year |
Grant no. |
Total allocation(rupees in crore) |
Percentage of savings |
2003-04
|
XX. Labour and Employment
|
77.27
|
(-)3.11
|
XXX. Co-operation |
99.48
|
(-)5.46
|
|
XXXII Rural Development
|
775.61
|
(-)16.06
|
|
XXXVI. Industries and Commerce |
156.55
|
(-)0.39
|
|
|
2004-05 |
X. Fiscal Administration
|
21313.11
|
(-)14.78
|
XX. Labour and Employment
|
150.82
|
(-)8.64
|
|
XXI. Social Welfare |
885.00
|
(-)12.01
|
|
XXVIII Animal Husbandry and Fisheries
|
223.97
|
(-)12.14
|
|
XXX Co-Operation
|
466.66
|
(-)9.40
|
|
XXXII Rural Development
|
748.03
|
(-)17.25
|
|
XXXIII. Major and Medium Irrigation |
5563.43
|
(-)10.55
|
|
XXXVI. Industries and Commerce |
179.03
|
(-)27.08
|
|
|
2005-06 |
IX Fiscal Administration, Planning,
Surveys,
Statistics
|
22183.51
|
(-)26.35
|
XI Roads, Buildings and Ports
|
2044.07
|
(-)3.98
|
|
XX Labour and Employment
|
154.42
|
(-)3.58
|
|
XXI Social Welfare |
1032.91
|
(-)37.14
|
|
XXX Co-operation |
181.03
|
(-)45.96
|
|
XXXIV Minor Irrigation |
634.10
|
(-)34.49
|
|
XXXVI Industries and Commerce
|
418.91
|
(-)37.35
|
|
|
2006-07 |
IX Fiscal Administration, Planning,
Surveys,
Statistics
|
20081.01 |
(-)16.85 |
XI Roads, Buildings and Ports
|
2105.49
|
(-)1.55
|
|
XVI Medical and Health
|
2165.03
|
(-)13.60
|
|
XXII Tribal Welfare |
739.12
|
(-)27.58
|
|
XXX Co-operation |
227.76
|
(-)15.31
|
|
XXXIII Major and Medium Irrigation |
12619.72
|
(-)12.59
|
|
XXXVI Industries and Commerce
|
443.86
|
(-)38.50
|
|
|
2007-08 |
IX. Fiscal Administration
|
23923.09
|
(-)16.61
|
XVI Medical and Health
|
2841.33
|
(-)10.95
|
|
XXI. Social Welfare |
1787.47
|
(-)18.82
|
|
XXVII Agriculture
|
1435.07
|
(-)11.56
|
|
XXVIII Animal Husbandry&Fisheries
|
621.56
|
(-)19.38
|
|
XXXIV Minor Irrigation
|
911.71
|
(-)23.41
|
|
XXXVI. Industries and Commerce |
767.27
|
(-)22.40
|
RECONCILIATION
OF ACCOUNTS
Accuracy
and reliability of accounts depend, among other things, on timely
reconciliation of the departmental figures with the accounts figures.
Before
annual accounts are finalised, the Heads of the Departments reconcile the
departmental accounts figures with those booked in accounts compiled by the
Accountant General. The reconciliation
of accounts figures is to be done monthly but in the year 2007-2008, there was
delay in reconciliation of the accounts by the departmental authorities.
A list of departments/controlling officers who persistently defaulted in reconciliation for the past several years is brought out below.
|
Sl.No. |
Name of the Department/Chief Controlling Officer |
Year/Years pending |
|
1. |
Secretary, Environment, Forest, Science & Technology |
1997-98 to 2007-08 |
|
2. |
Secretary, Finance |
1997-98 to 2007-08(Except 2003-04) |
|
3. |
Secretary, Food and Civil Supplies |
1997-98 to 2007-08 |
|
4. |
Secretary, Home |
1997-98 to 2007-08 |
|
5. |
Secretary, Irrigation and Command Area Development |
2000-01 to 2007-08 |
|
6. |
Secretary, Industries and Commerce |
1997-98 to 2007-08 |
|
7. |
Secretary, Energy |
1997-98 to 2007-08 |
|
8. |
Secretary, Revenue |
1997-98 to 2007-08 (except 2000-01) |
|
9. |
Secretary, Secondary Education |
1998-99 to 2007-08 |
|
10. |
Secretary, Social Welfare |
1998-99 to 2007-08 |
|
11. |
Secretary, State Roads Department |
1996-97 to 2007-08 (except 1998-99 to 2000-01) |
|
12. |
Secretary, Women Development, Child Welfare and Welfare of Disabled |
1997-98 to 2007-08 |
|
13. |
Secretary, Health, Medical & Family Welfare |
1997-98 to 2007-08 |
|
14. |
Registrar of Cooperative Societies |
1999-00 to 2007-08(except 01-02&06-07) |
|
15. |
Commissioner, Land Administration |
1999-00 to 2007-08 |
|
16. |
Secretary, Youth Advt,Tourism&Culture Department |
1996-97 to 2007-08(except 99-00 to 01-02) |
|
17. |
Secretary, Tribunal for Disciplinary Proceedings |
1997-98 to 2007-08 (except 2001-02 to 2003-04) |
SUBMISSION
OF ACCOUNTS BY TREASURIES
The
rendition of initial accounts by the Treasuries is satisfactory. The maximum delay in receipt of accounts
from some treasuries during the year was 17 days. However, 12 Public Works Divisions have submitted their accounts
very late in different months during the year. The delay ranged from 16 to 60 days. The fact of late
receipt/non-receipt of monthly accounts was brought to the notice of the
concerned authorities, as and when the delay occurred.
CHAPTER III
TRENDS IN
GOVERNMENT REVENUE AND EXPENDITURE
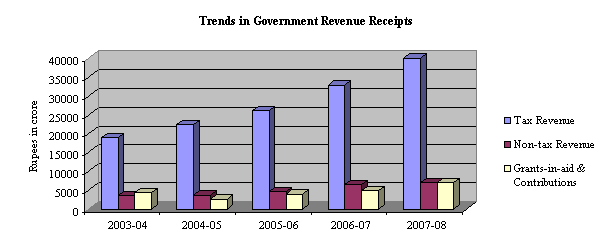
Trends in Government Revenue Receipts and Revenue Expenditure from 2003 to 2008 (5 years period) is given below.
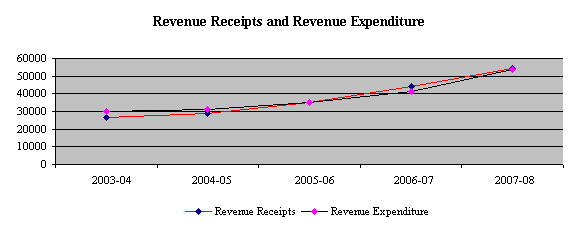
Revenue Receipts (Rupees in crore)
|
Year |
Tax Revenue |
Non-Tax Revenue |
Grants-in-aid and Contributions |
Gross Revenue Receipts |
GSDP |
Percentage of
Gross Revenue Receipts to GDP |
|
2003-04 |
18874.46 |
3604.65 |
4389.39 |
26868.50 |
177883.00(A) |
15.10 |
|
2004-05 |
22313.01 |
3755.57 |
2680.92 |
28749.50 |
199075.00(A) |
14.44 |
|
2005-06 |
26158.26 |
4691.37 |
4001.56 |
34851.19 |
225892.00(A) |
15.43 |
|
2006-07 |
32792.20 |
6487.83 |
4965.44 |
44245.47 |
260734.00(A) |
16.97 |
|
2007-08 |
39977.69 |
7064.13 |
7100.63 |
54142.55 |
311752.00(A) |
17.37 |
(A) Advance Estimates
Revenue Expenditure
(Rupees in crore)
|
Year |
Revenue
Expen-diture |
Total
Expen-diture |
GSDP |
Percentage
increase |
Percentage of Government Expenditure to GSDP |
||
|
Revenue Expen-diture |
Total
Expen-diture |
GSDP |
|||||
|
2003-04 |
29830.14 |
35574.64 |
177883.00(A) |
14.48 |
(-)7.83 |
10.65 |
20.00 |
|
2004-05 |
31307.34 |
38314.71 |
199075.00(A) |
4.95 |
7.70 |
11.91 |
19.25 |
|
2005-06 |
34915.30 |
43333.47 |
225892.00(A) |
11.53 |
13.10 |
13.47 |
19.18 |
|
2006-07 |
41438.40 |
52249.09 |
260734.00(A) |
18.68 |
20.57 |
15.42 |
20.04 |
|
2007-08 |
53983.57 |
69678.23 |
311752.00(A) |
30.27 |
33.36 |
19.57 |
22.35 |
(A) Advance Estimates
The
overall increase in the Government’s total expenditure during 2007-2008
compared to 2003-2004 (5 years) has been Rs.34,103.59 crore. Expenditure pattern in major areas of
Revenue Expenditure is shown in the following table:
Increase/decrease of expenditure in major
areas of Revenue Expenditure
|
Areas of
expenditure |
Increase/Decrease
over the previous year (in crores
rupees) |
% of increase/
decrease in 2007-2008 over last year’s expenditure |
|
||||
|
2003-04 |
2004-05 |
2005-06 |
2006-07 |
2007-08 |
|
||
|
Interest Payments and Servicing of Debt |
725.22 |
235.47 |
116.35 |
286.02 |
472.05 |
6.29 |
|
|
Education, Sports, Art and Culture |
640.03 |
(-)73.01 |
744.77 |
698.09 |
569.21 |
9.43 |
|
|
Water Supply, Sanitation, Housing and Urban Development |
322.76 |
199.09 |
655.40 |
684.10 |
1152.66 |
43.70 |
|
|
Social Welfare and Nutrition |
119.78 |
300.49 |
79.97 |
1028.81 |
206.42 |
7.40 |
|
|
Agriculture and Allied Activities |
212.55 |
112.42 |
3.71 |
238.30 |
636.56 |
44.26 |
|
|
Irrigation and Flood Control |
112.93 |
46.03 |
699.04 |
556.15 |
1482.07 |
46.66 |
|
|
Industry and Minerals |
18.26 |
(-)26.10 |
72.51 |
(-)22.21 |
291.26 |
125.49 |
|
Trend in Expenditure on Salary and Pension Components
|
Head
|
2003-04 |
2004-05 |
2005-06 |
2006-07 |
2007-08 |
|||||
|
Rs.
in crore |
%
to total Revenue Receipt |
Rs.
in crore |
%
to total Revenue Receipts |
Rs.
in crore |
%
to total Revenue Receipts |
Rs.
in crore |
%
to total Revenue Receipts |
Rs.
in crore |
%
to total Revenue Receipts |
|
|
Salary(*) |
5021.66 |
18.69 |
5132.71 |
17.85 |
8241.86 |
23.65 |
9693.95 |
21.91 |
10640.43 |
19.65 |
|
Pension Payment |
2425.26 |
9.02 |
3016.78 |
10.49 |
3196.95 |
9.17 |
4150.49 |
9.38 |
5092.13 |
9.40 |
(*) The
figures represent expenditure booked under the object head ‘salary’ only

GOVERNMENT
ACCOUNT
The
total expenditure (Revenue and Capital) for the year is netted against total
receipts (Revenue and non-debt Capital receipts) of the year and the
surplus/deficit thereof is transferred to a separate ledger called “Government
Account”. In addition, net effect of Prior Period Adjustments, Miscellaneous
Government Accounts, etc. is also transferred to the ledger “Government
Account”. Thus, the ledger “Government Account” represents the cumulative
surplus/deficit of the operations of the Government. The details of the ledger “Government Account” for the past five
years are given below.
(Rupees in crore)
|
Year |
Revenue Heads |
Capital Heads |
Other Heads (#) |
Deficit for the year |
Cumulative deficit/surplus at the end of the year |
||||
|
|
Receipts |
Disbursements |
Deficit/ Surplus |
Receipts (Non-debt) |
Disbursements |
Deficit/ Surplus |
Deficit/ Surplus |
|
|
|
2003-04 |
26868.50 |
29830.14 |
(-)2961.64 |
… |
4250.87 |
(-)4250.87 |
… |
(-)7212.50 |
(-)52910.19 |
|
2004-05 |
28749.50 |
31307.34 |
(-)2557.84 |
… |
5414.23 |
(-)5414.23 |
… |
(-)7972.07 |
(-)60882.26 |
|
2005-06 |
34851.19 |
34915.30 |
(-)64.11 |
… |
7661.68 |
(-)7661.68 |
… |
(-)7725.79 |
(-)68608.05 |
|
2006-07 |
44245.47 |
41438.40 |
2807.07 |
1889.32 |
9904.00 |
(-)8014.68 |
… |
(-)5207.61 |
(-)73815.66 |
|
2007-08 |
54142.55 |
53983.57 |
158.98 |
6557.71($) |
12773.94 |
(-)6216.23 |
(-)1.20 |
(-)6058.45 |
(-)79874.11 |
(#) Miscellaneous Government Account.
($)Represents sale proceeds of land and property, incorrectly
classified under Capital Receipts instead of under Revenue Receipts
.
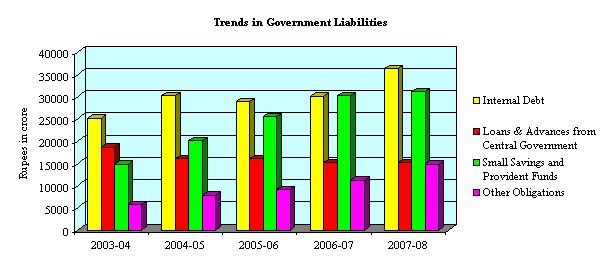
LIABILITIES
Liabilities of the State
Government increased by Rs.32,823.05 crore from Rs.64545.44 crore in 2003-2004 to Rs.97368.49 crore during
2007-2008. Public debt comprising
internal debt of the State Government and loans and advances from the Central
Government increased by Rs.7512.79 crore from Rs.43,882.10 crore in 2003-2004
to Rs. 51,394.89 crore at the end of the current year. Article 293 of the Constitution of India
empowers the State Government to borrow on the security of the Consolidated
Fund of the State within such limits, if any, as may be from time to time fixed
by the State Legislature. Details of the
Public Debt and total liabilities of the State Government are as under:
(Rupees in
crore)
|
Year |
Internal Debt |
Loans & Advances from Central Govern-ment |
Total Public Debt |
Small Savings and Provident Funds |
Other Obliga-tions(*) |
Total Liabilities |
GSDP |
% of total liability to GDP |
|
2003-04 |
25175.71 |
18706.39 |
43882.10 |
14888.15 |
5775.19 |
64545.44 |
177883.00(A) |
36.29 |
|
2004-05 |
30153.33 |
16129.14 |
46282.47 |
20110.71 |
7895.22 |
74288.40 |
199075.00(A) |
37.32 |
|
2005-06 |
28913.70 |
16044.75 |
44958.45 |
25449.07 |
9141.79 |
79549.31 |
225892.00(A) |
35.22 |
|
2006-07 |
30086.82 |
15169.13 |
45255.95 |
#30165.45 |
# 11200.79 |
86622.19 |
260734.00(A) |
33.22 |
|
2007-08 |
36269.20 |
15125.69 |
51394.89 |
31084.07 |
14889.53 |
97368.49 |
311752.00(A) |
31.23 |
(*)Non-interest bearing obligations such
as deposits of Local Funds, Other earmarked funds, etc.
(A)Advance Estimates
# Rs.21.72 Crores hither to booked under MH 8011,transferred
proforma to MH 8342 being transactions pertaining to Contributory Pension
Scheme.
STATE
PROVIDENT FUND
The details of transactions from the State Provident Fund
are shown in the following table.
(Rupees in crore)
|
Year |
Opening Balance |
Receipts . |
Payments |
Net accretion for the year |
Closing Balance |
Interest charged on balance of P.F |
|
2003-04 |
2975.56 |
1085.48 |
750.54 |
334.94 |
3310.50 |
247.49 |
|
2004-05 |
3310.50 |
1057.46 |
798.94 |
258.52 |
3569.02 |
253.02 |
|
2005-06 |
3569.02 |
1167.07 |
794.87 |
372.20 |
3941.22 |
273.23 |
|
2006-07 |
3941.22 |
1441.38 |
917.66 |
523.72 |
4464.94 |
331.53 |
|
2007-08 |
4464.94 |
1632.17 |
1049.46 |
582.71 |
5047.65 |
475.61 |
GUARANTEES
The
position of guarantees by the State Government for the payment of loans and
capital and payment of interest thereon raised by Statutory Corporations,
government companies, Corporations, Cooperative Societies, etc. is given below.
(Rupees in crore)
|
At the end of the year |
Amount Guaranteed (Principal only) |
Amount outstanding Principal Interest |
|
|
2003-04 |
29545.13 |
17427.15 |
756.80 |
|
2004-05 |
28164.93 |
17893.21 |
807.81 |
|
2005-06 |
30200.10 |
17711.05 |
779.16 |
|
2006-07 |
29160.39 |
18018.32 |
864.44 |
|
2007-08 |
18797.84 |
14502.10 |
166.60 |
WAYS
AND MEANS ADVANCES
The
State Government, in order to maintain and sustain its liquidity position,
takes Ways and Means Advances from the Reserve Bank of India and thereafter,
draws upon overdraft whenever there is shortfall in the agreed minimum cash
balance in its account with the Reserve Bank of India. The State Government is
required to maintain a minimum cash balance of Rs.3.32 crore on all days with
Reserve Bank of India. The larger the amount and greater the number of times
such ways and means advances are taken (Operative limit of Rs.880 crore) or
overdrawals made, the more it reflects on the adverse position of the cash
balance of the State Government.
During
the year 2007-2008 the State Government was able to maintain the minimum
balance on each day of the year i.e., all the 365 days. As such there was no necessity for State
Government to resort to Ways and Means Advance and Overdraft from Reserve Bank
of India, Nagpur.
|
|
2003-04 |
2004-05 |
2005-06 |
2006-07 |
2007-08 |
|
i) Number of
days on which minimum
balance was maintained |
|
|
|
|
|
|
a) Without obtaining any advance |
154 |
365 |
365 |
365 |
365 |
|
b) By obtaining Ways and Means Advance |
181 |
Nil |
Nil |
Nil |
Nil |
|
ii) Number of
days on which overdraft was taken |
31 |
Nil |
Nil |
Nil |
Nil |
GENERAL
CASH BALANCES
The
Cash Balance with Reserve Bank of India decreased from Rs(-)280.84 crore at the
beginning of the year 2007-2008 to Rs.(-)205.90 crore at its end, the details
of sources and application of funds being as follows:
Cash Flow Statement
(Rupees in crore)
|
SOURCES |
APPLICATION |
||||
|
Sl. No. |
Items |
Amount |
Sl. No. |
Items |
Amount |
|
1 |
Opening
Cash Balance |
(-)280.84 |
1 |
Revenue Expenditure Non-Plan Plan Total |
40082.98 |
|
2 |
State’s
Share of Union Taxes |
11183.64 |
13900.58 |
||
|
53983.56 |
|||||
|
3 |
State’s
own revenue collection |
35858.18 |
2 |
Capital ExpenditureNon-PlanPlanTotal |
(-)91.73 |
|
4 |
Central
grants/ assistance other than loans |
7100.73 |
12865.67
|
||
|
5 |
Miscellaneous
receipts (MH 4000 - Misc. Capital Receipts |
6557.71 |
3 |
GOI Loans and Advances repaid
|
952.43 |
|
6 |
Net
Receipts from Internal Debt, Small Savings, Deposits and Advances (Other than
Central Loans) |
10538.75 |
4 |
Loans and Advances given |
2920.72 |
|
5 |
Net effect of adjustment of
Suspense & Remittance balances and increase of Reserve Fund |
1632.79 |
|||
|
7 |
Receipts
from Central Loans |
908.99 |
6 7 |
Net contribution from
Contingency Fund Closing cash balance |
0.57 (-)205.90 |
|
8. |
Recoveries from Borrowers |
190.95 |
|||
|
|
Total |
72058.11 |
|
Total |
72058.11 |
The
closing cash balance of Rs.(-)205.90 crore is inclusive of general cash balance
of Rs.(-)212.62
crore, deposits with other banks of Rs.1.34 crore and remittances in transit
of Rs.5.38 crore The closing cash balance according to the
Reserve Bank of India was Rs.211.10crore (debit) against the general cash
balance of Rs.212.62(credit) reflected in State Govt. accounts. The Net
difference of Rs.1.52 (credit) crore is under reconciliation.
Investments
held in the Cash Balance Investment Account as on 31 March 2008 were Rs.6368.16
crore.
Other
cash balances and investment comprising cash with departmental officers
(Rs.0.93 crore), permanent advances with departmental officers (Rs.1.36 crore)
and investment of earmarked funds (Rs.2347.43 crore) as on 31 March 2008, were
Rs.2349.72 crore.
CONTINGENCY
FUND
Contingency
Fund of the State with a corpus of Rs.50 crore is designed to meet
contingencies. The following details will indicate the extent of use of this
Fund during the year
|
|
2003-04 |
2004-05 |
2005-06 |
2006-07 |
2007-08 |
|
Number
of withdrawals from Contingency Fund |
243 |
115 |
115 |
108 |
103 |
|
Total
withdrawals from Contingency Fund (Rs in crore) |
32.06 |
24.17 |
4.99 |
6.91 |
5.87 |
|
Withdrawals
from Contingency Fund as a percentage to Total Budget provision |
0.08 |
0.05 |
0.01 |
0.01 |
0.01 |
****